| Home |
| About Us |
| Methods |
| Sample Sites
|
| Data Repository |
| Acknowledgements |
Commencement Bay |
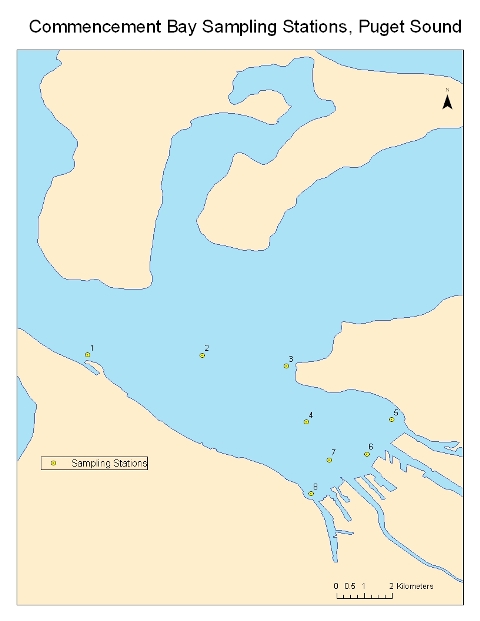
Results/Discussion: The Commencement Bay has been previously sampled by research students from the University of Washington. The results from Spring 2009 are compared to the previous data recorded by former research students which is given in the Summary. This collection of data provides a historical background for subsequent UW research students that will be sampling this area in the future. The master log, CTD data, and nutrient data from the San Juan Island archipelago can be accessed by linking to the data repository located at the main option bar. This section discusses results from the CTD profile, Niskin bottle sample analysis, secchi depth, plankton and grain size analysis. All graphs are oriented as seen in the map.
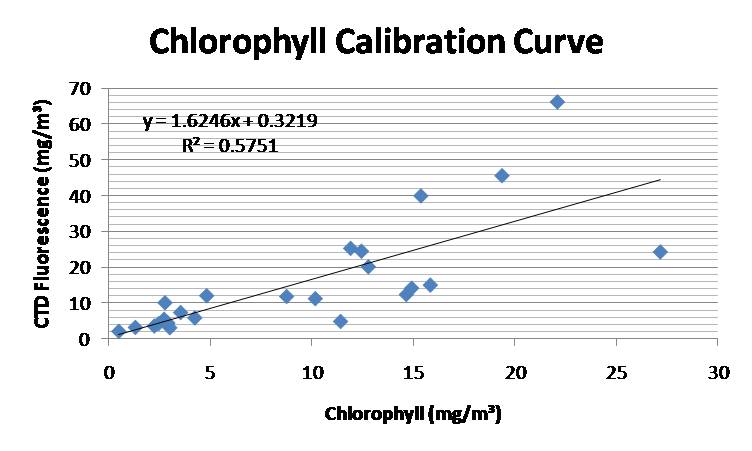
Commencement Bay Map (Click to Enlarge) Below is a calibration curve comporing our measured dissolved oxygen and chlorophyll levels with the CTD measurements
The data for the dissolved oxygen and the flourescence concentrations were analyzed in two different ways; The first analaysis was done by the CTD and the second was done using lab procedures. When using the results of the different methods plotted against each other, the quality of the data can be observed by analyzing the best fit line of the data. The equations for the best fit lines of the data are recorded on the plots. to the rith is the correlation curve found for the Dissolved Oxygen and the one at the left is the correlation curve found for the Fluorescence data. The R2 value represents the precision of the data compared to the best fit line.
Temperature of Transect 1 (Stations 1,2, and 3)
Temperature of Transect 2 (Stations 5, 6, 7, and 8)
Temperature of Transect 3 (Stations 2, 4, and 7)
Blue transect 1,2,and 3 Surfer plots show the temperatures found in all eight stations. The plot shows depth in meters at the (Y) axis the and Degrees Celsius in the (X). All of the transects had a layer of warmer water at the surface and cooler layers with increasing depth. Transect 3 had the most stratified variability in temperature which could be from the river outlets flowing into the Bay.
Fluorescence of Transect 1 (Stations 1,2, and 3)
Fluorescence of Transect 2 (Stations 5, 6, 7, and 8)
Fluorescence of Transect 3 (Stations 2, 4, and 7)
Green transect 1, 2, and 3 Surfer plots show the Flourescence level found in all eight stations. The plot shows the depth in meters on the (y) axis and Fluorescence in milliliters per liter on the (X) axis. Transect 1 and 3 had the most fluorescence from the thermocline to the surface, while transect 2 had more mixing of fluorescence levels. The Commencement Bay waterway samples contained the highest amount of chlorophyll concentrations in the thermocline and this could be because the area had a lot of tidal mixing. The Sewage plume waters and the Thea Foss exhibited a higher scattering of phytoplankton layers and chlorophyll. The Sewage plume and Thea Foss stations showed slight increases in fluorescence, which indicates that sewage and the Thea Foss affects phytoplankton growth. This could be that the sewage treated water and the Thea Foss contain more nutrients, which create a better environment for phytoplankton growth.
Transmissivity of Transect 1 (Stations 1,2, and 3)
Transmissivity of Transect 2 (Stations 5, 6, 7, and 8)
Transmissivity of Transect 3 (Stations 2, 4, and 7)
Yellow transect 1, 2, and 3 Surfer plots show transmissivity in all eight stations. The plot shows the depth in meters on the (y) axis and transmissivity in % on the (X) axis. Transect 2 had more stratified layers than the other two, and transect 1 had the least varience in %.
Dissolved Oxygen of Transect 1 (Stations 1,2, and 3)
Dissolved Oxygen of Transect 2 (Stations 5, 6, 7, and 8)
Dissolved Oxygen of Transect 3 (Stations 2, 4, and 7)
Orange transect 1, 2, and 3 Surfer plots show dissolved oxygen levels in all eight stations. The plot shows the depth in meters on the (y) axis and dissolved oxygen in milligrams per liter on the (X) axis. Transect 1 and 3 had the highest dissolved oxygen levels from the thermocline to the surface, while transect 2 had more mixing of fluorescence levels which is possitively correlated with the fluorescence levels at each transect. This shows that the dissolved oxgen levels in the Bay are largely dependant on phytoplankton photosynthesis. The result of photosynthesis and respiration determines the concentration of dissolved oxygen, which in turn indicates the production of biomass and this could be why it was highest in stations 1 and 2 and lowest at stations 4 and 5. Salinity of Transect 1 (Stations 1,2, and 3) Salinity of Transect 2 (Stations 5, 6, 7, and 8)
Salinity of Transect 3 (Stations 2, 4, and 7)
Red transect 1, 2, and 3 Surfer plots show salinity levels in all eight stations. The plot shows the depth in meters on the (y) axis and salinity in SPUr on the (X) axis.Surfer plot showing the salinity levels found in all four stations. There was slight variability, but salinity stratification was similar throughout transects 1 and 3 with a very low salinity surface layer at transect 2 from river output.
Density of Transect 1 (Stations 1,2, and 3)
Density of Transect 2 (Stations 5, 6, 7, and 8)
Density of Transect 3 (Stations 2, 4, and 7)
Transect 1, 2, and 3 Surfer plots show density in all eight stations. The plot shows the depth in meters on the (y) axis and density in milligrams per liter on the (X) axis.The Density data showed similar characteristics as seen in the salinity graph. Density was greatest at depths below -100m at all three transects. There was slight variability, but density stratification was similar throughout transects 1 and 3 with a very low salinity surface layer at transect 2 from river output.
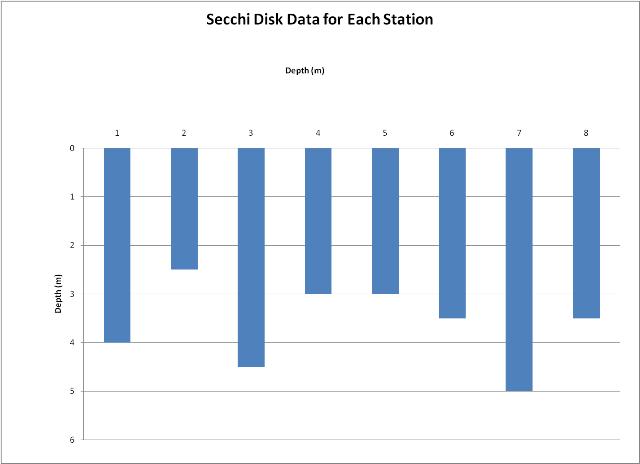
Secchi Measurements
The Secchi measurements read from 2.5 to 5 meters deep, which is comparitively low with other areas in the Puget Sound. Station 2 had the lowest measurement, meaning there is more nutrients, suspended particles, and organisms in the water. Station 7 had the highest measurement, which is odd because it should have a lower reading from the river bringing in suspended materials. During sampling, the weather changed from sunnday to cloudy multiple times, which could explain some variation in the secchi measurements as well.
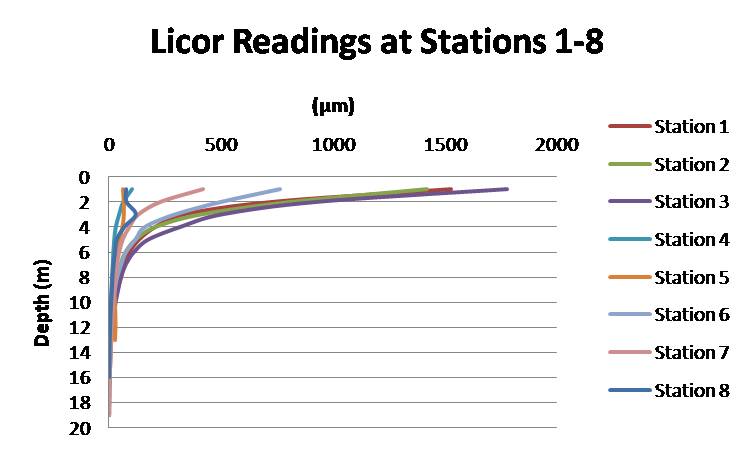
Licor
The licor readings were continuous readings showing an inverse relationship between depth and the amount of electromagnetic radiation, which should be in agreement with the secchi measurements. The stations do resemble measurements from the secchi readings except station 2, which had a higher licor reading, and 7, which had a much lower licor reading. The licor readings make more sense than the secchi readings when comparing with runnoff and suspended sediment expected at each station.
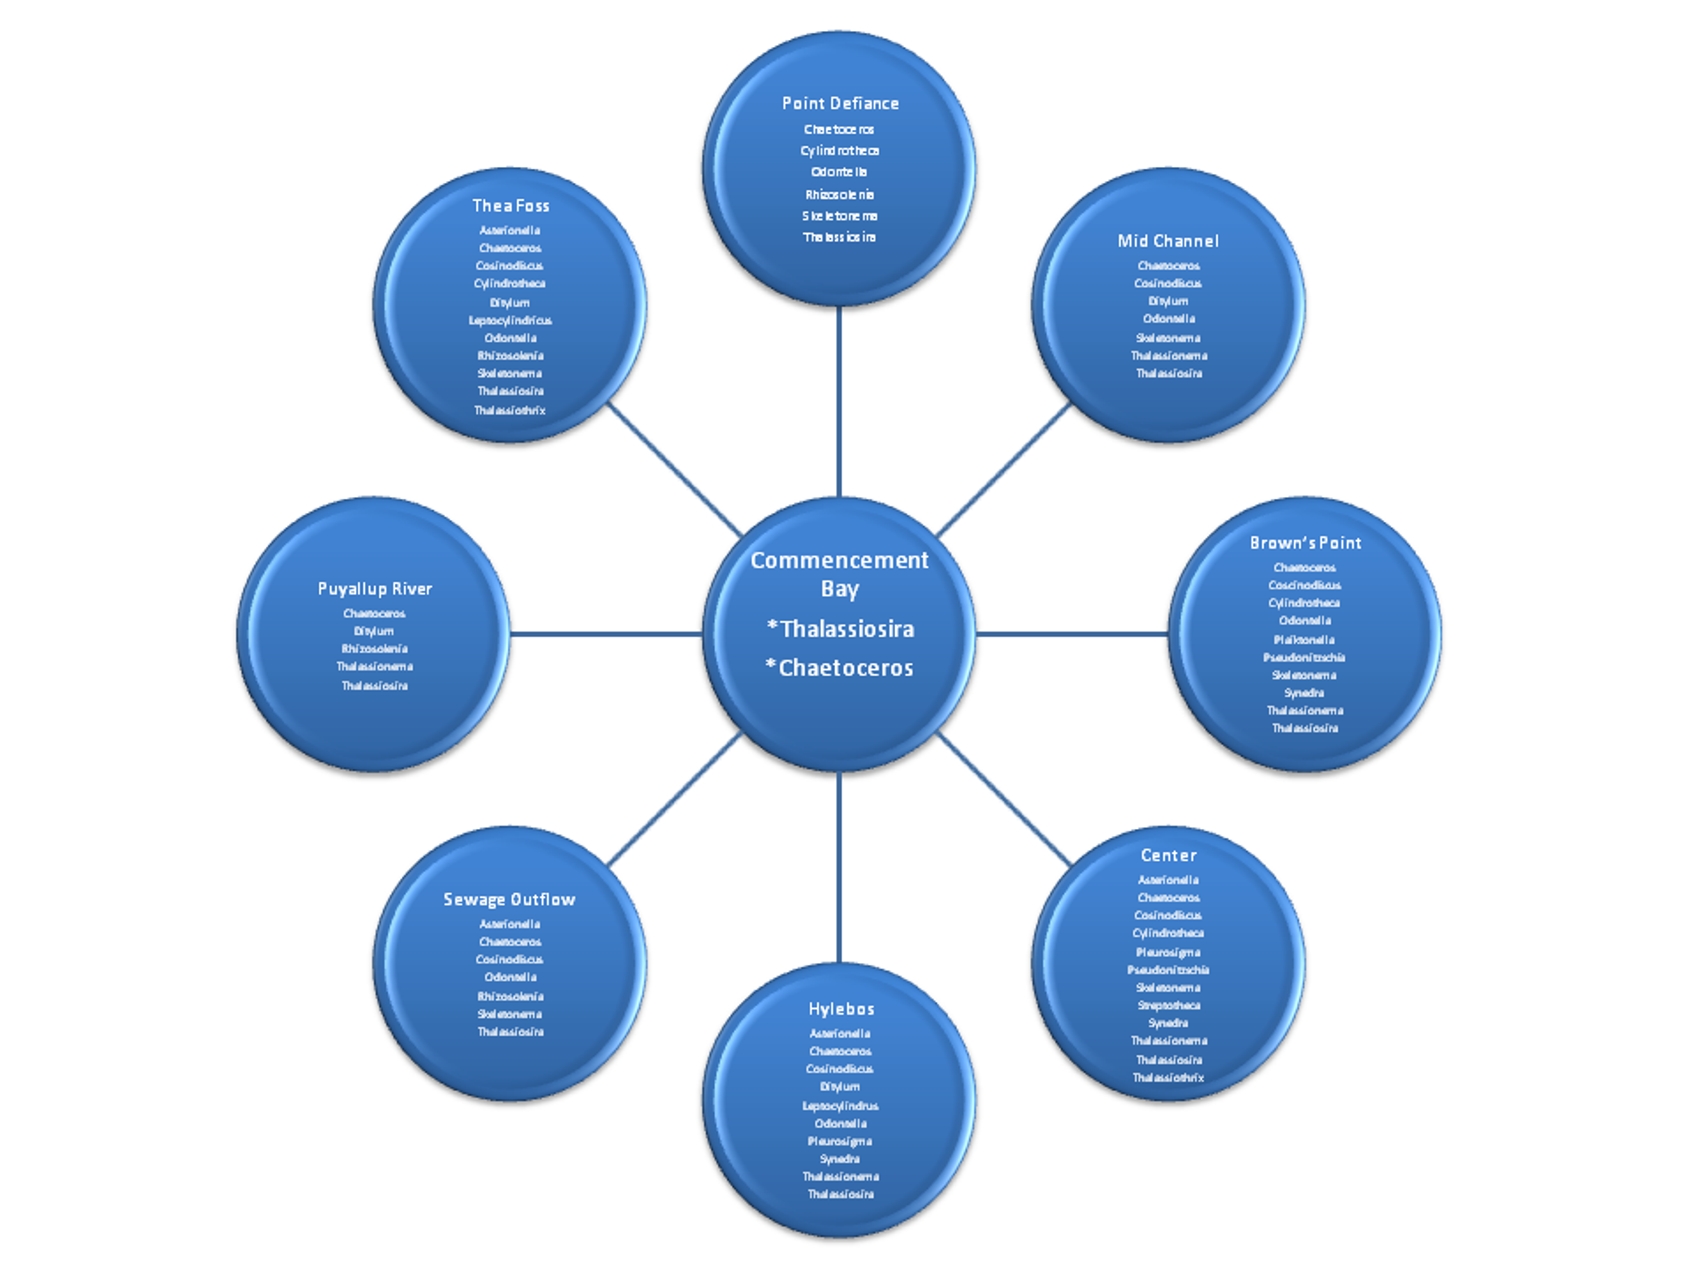
Phytoplankton
the figure of the phytoplankton showed the diiversity of phytoplankton at each station with the most common genus from each station sown in the middle. Looking at the data through analysis, it was observed that stations 4 and 8 contained the highest abundance in phytoplankton genus and 1 and 7, the least. The amount of phytoplankton genus found depends on the amount of nutrients, grazing by zooplankton, amount of light passing through the water column as well as toxins.
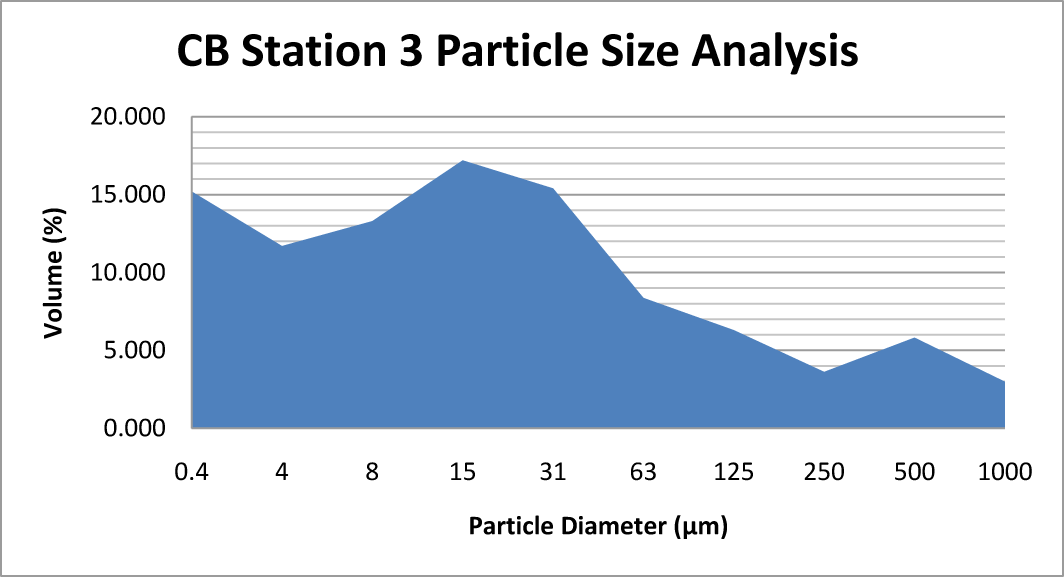
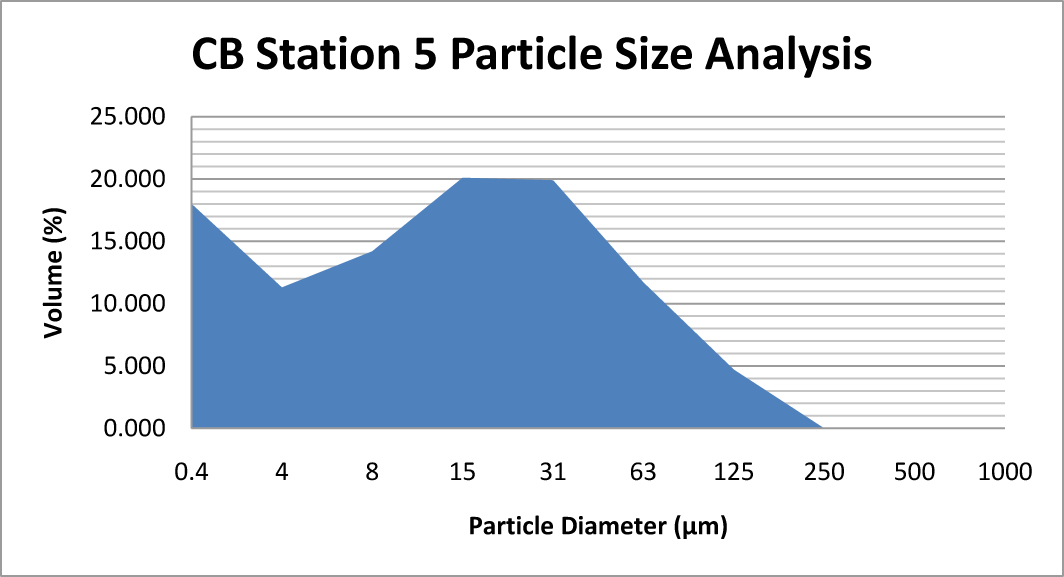
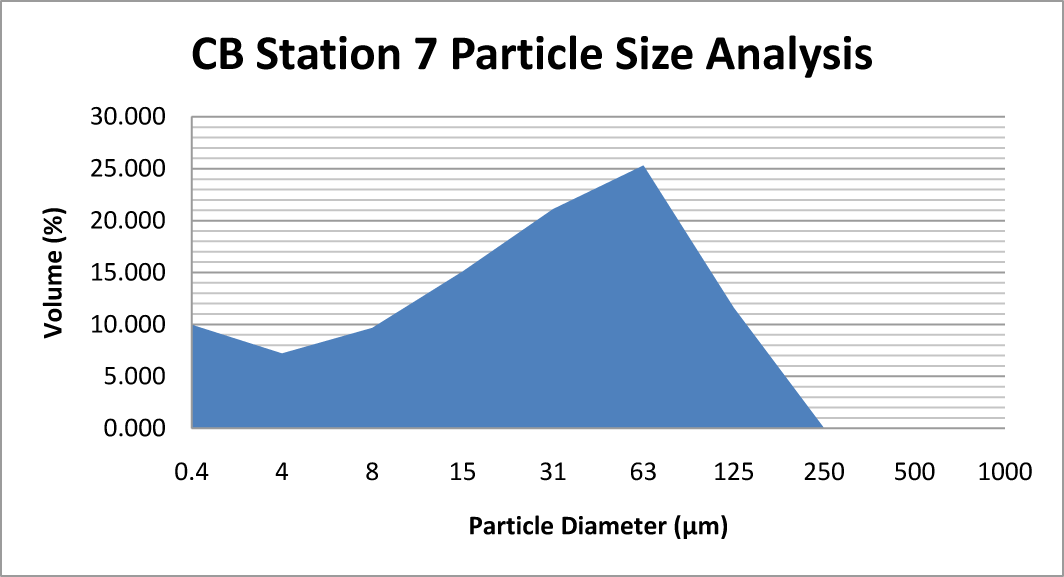
Sediment (Grain Size)
Most of the sampled sediment had atleast 20% total particle sizes of 30 µm, which was also the majority size particle in the sediment, which is fairly fine. Station 3 had the highest mixing of sizes from 0 to over 1000µm. All other stations had 0 to about 250µm particle diameters, showing that the sediment misture is fairly similar throughout the Bay besides station 3, which was possibly due to heavy currents moving through the river draining into the Bay.
Total Organic Carbon
Stations 5 and 6 had the highest levels of composed organic carbon in sediment, while station 3 had the lowest level. Viewed on the map, station 5 is located in a corner of Commencement Bay infront of a river outlet, which may be constantly pushing organic sediment out of the river into the Bay. Station 3 is up against a spit in the Bay, which does not explain why the organic carbon is so low. |
|